Part 1 gave some context around why I got a Dylos DC1100 PRO air monitor. In short: China.
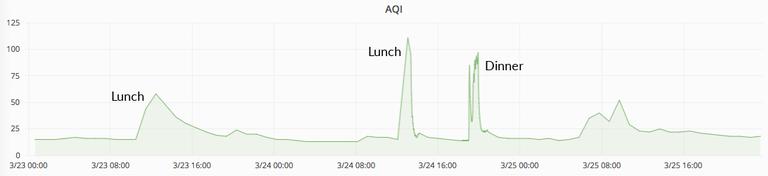
My wife and I are now back in North California and the air is much better. We live about 100 feet from a major road though, and I started wondering about the impact of morning and evening commutes on air quality.
So I brought my old Dylos back to active duty.
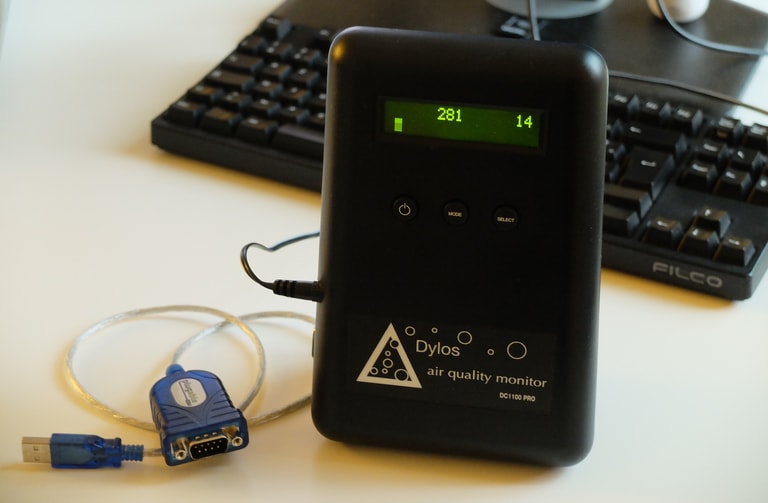
The old-school two-line display is perfect for a quick live read, but not so great for accessing historical data. Thankfully, this model comes with a serial port, over which it sends one measurement per minute or hour. Few computers have built-in serial ports these days, but Serial-to-USB adapters are easy to find and work well. Just make sure to buy one that comes with drivers for your favorite OS. I bought a Plugable a few years back that offers drivers for Windows, OS X, and Linux. (Rant: The missing g in Plugable irks me, just like Cristaline water used to back in France.)
Dylos offers ready-made software for getting data out of the serial port and plotting graphs. This software only runs on Windows, and the output can’t easily be embedded in a webpage, so I decided to roll my own.
Architecture
It’s a toy project, but let’s try to build something decent anyway. We want:
- Speed. Fetching data from any browser anywhere should be fast.
- Availability. Data should still be available even if home internet or power goes down.
- Durability. No data should be lost even if home internet or power goes down.
Running everything on a single computer at home doesn’t meet the first two requirements. So we need a server somewhere. I already had a $5/mo VPS on Digital Ocean, so I went with that. It’s cheap but still easily beats my home internet connection in latency, throughput and uptime.
This brings us to a simple architecture:
- The Dylos transmits a live measurement to a home computer via serial.
- The home computer transmits this measurement to a server.
- The server inserts this measurement into a database.
- Some JS in a webpage fetches measurements from the server and displays them in a human-friendly manner.
There’s one issue though. If home internet goes down, or the server goes down, then the home computer cannot transmit live measurements anymore and loses data. This leads us to split step 2 above into two:
- A process on the home computer appends the live measurement to a queue.
- Another process on the home computer transmits queued measurements to a server, and removes them from the queue if successful.

We use a persistent queue (instead of purely in-memory) to avoid losing queued measurements in case of a loss of power.
That’s it! Comcast can bring internet down for an hour, or the server can go offline for a day—in both cases there won’t be any data loss. We will lose data only if:
- Home power goes down, in which case the Dylos itself will stop emitting new measurements. Solution: UPS.
- The server crashes and the database is unrecoverable. Solution: traditional DB techniques such as replication and backups.
I don’t care enough about this data to implement any of these solutions, but it’s good to know they are available.
Tech stack
Off-the-shelf monitoring solutions exist (e.g. Sensu), but it seemed fun to write my own code for communicating over serial and a shared queue. :)
I picked Redis for the queue:
- Good durability with AOF.
- Runs on ARM (required for Raspberry Pi).
- Blocking read commands (faster and more elegant than polling).
And Rust for the glue code:
- Compiles to ARM.
- Popular enough to have libraries for serial, Redis and HTTP.
- If it compiles, then it (probably) works—including decent error handling.
- I enjoy Rust and like keeping up with its evolution. That was likely the most important reason. :)
On the other hand, I had very little interest in the DB and graph rendering part, so I went with InfluxDB and Grafana and was done in about 5 minutes.
Since InfluxDB offers an HTTP API, measurements can be sent straight to it. But Dylos measurements need to be converted from particle count per cubic foot to a more human-readable AQI (Air Quality Index, see Part 1). The home computer can do this conversion at the source, but that’s generally a bad architecture decision. Ideally, devices should contain as little code as possible, and send raw data only, with any further processing left to the servers. Most reasons for that are moot for this toy project, but apply to many real-world cases:
- Devices often have separate codebases (e.g. a Swift codebase for iOS and a Kotlin codebase for Android). Duplicating code increases maintenance and can introduce inconsistencies.
- Devices often have tighter performance constraints than servers (e.g. power consumption or 16 ms budget per frame).
- Devices are much harder to update than servers.
So I wrote a tiny HTTP server that receives raw measurements, adds a field with the computed AQI, and writes the whole thing to InfluxDB. This also makes it easier to swap InfluxDB with another DB later.
That’s it! It was a fun week-end project. The code is on GitHub, and the dashboard is live here.